Zdenduino - Wireless and ADC Testing - Part 4
Where Part 3 Left Off
In Part 3, Zdenduino finally got online. The board connected to Wi-Fi, served a tiny web page, and controlled an LED from the browser.
That was a big step, because it changed the project from “my custom ESP32-C3 board can blink” to “my custom ESP32-C3 board can talk to the outside world.” USB worked, GPIO worked, and Wi-Fi worked. Very nice.
But one successful web LED test is still only one test. I wanted to push the board a bit further and check more of the everyday ESP32-C3 toolbox: PWM, ADC, and Bluetooth Low Energy.
What I Want to Try Next
This part is not really a capability roadmap after all. It is more like a practical wireless and peripheral shakedown.
The idea is simple: take the board through a few small, focused tests and see whether the important pieces behave like they should. Nothing production-ready yet. Just enough code and wiring to prove that the board is useful beyond the first blink and the first web page.
The Plan
- PWM fade
- ADC reading
- BLE scanner
- BLE LED control
Test 1: PWM LED Fade
After the web LED test, the next obvious thing to try is PWM. A normal GPIO can only be fully ON or fully OFF, but PWM lets the ESP32-C3 switch the pin very quickly and change how long it stays ON during each cycle. To a human eye, that looks like brightness control.
For this test I connected a normal LED to IO04 through a current-limiting resistor. Nothing fancy. Just one LED, one resistor, and one GPIO pin doing the work.
The goal is simple:
- fade the LED up and down,
- verify that PWM works on IO04,
- watch the duty cycle change on the oscilloscope,
- confirm that the visible brightness follows the waveform.
1
2
3
4
5
6
7
8
9
10
11
12
13
14
15
16
17
18
19
20
21
22
23
24
25
26
27
28
29
30
31
32
33
34
35
36
37
38
39
40
41
42
43
#include <Arduino.h>
#include <esp_arduino_version.h>

const int ledPin = 4;
const int pwmChannel = 0;
const int pwmFrequency = 5000;
const int pwmResolution = 8;

void writePwm(int duty) {
#if ESP_ARDUINO_VERSION_MAJOR >= 3
  ledcWrite(ledPin, duty);
#else
  ledcWrite(pwmChannel, duty);
#endif
}

void setup() {
  Serial.begin(115200);
  delay(1000);

#if ESP_ARDUINO_VERSION_MAJOR >= 3
  ledcAttach(ledPin, pwmFrequency, pwmResolution);
#else
  ledcSetup(pwmChannel, pwmFrequency, pwmResolution);
  ledcAttachPin(ledPin, pwmChannel);
#endif

  Serial.println("Zdenduino PWM fade test on IO04");
}

void loop() {
  for (int duty = 0; duty <= 255; duty++) {
    writePwm(duty);
    Serial.printf("Duty: %d / 255\n", duty);
    delay(10);
  }

  for (int duty = 255; duty >= 0; duty--) {
    writePwm(duty);
    Serial.printf("Duty: %d / 255\n", duty);
    delay(10);
  }
}
Arduino-ESP32 compatibility note: Arduino-ESP32 2.x and 3.x use different LEDC APIs. Older examples usually use
ledcSetup(),ledcAttachPin(), andledcWrite(channel, duty). In Arduino-ESP32 3.x, the API changed to pin-based calls likeledcAttach(pin, frequency, resolution)andledcWrite(pin, duty). That is why this sketch checksESP_ARDUINO_VERSION_MAJORand uses the right version automatically. Tiny compatibility layer, much less head scratching.
If everything works, the LED should smoothly breathe from OFF to full brightness and back again.
This time the oscilloscope is the more interesting measurement. A multimeter can show the average voltage changing, but it hides the actual PWM behavior. The scope shows the real thing: a square wave with the same frequency and a duty cycle that grows and shrinks as the LED fades.
At 0, the signal should stay LOW. At 255, it should stay HIGH. Between those values, the ON-time should gradually change, and the LED brightness should follow it nicely.
And yes, looking at the oscilloscope while the LED fades: it is smooth as f*ck.
If you want to understand PWM properly instead of just watching the pretty square wave, the Wikipedia article about pulse-width modulation is a great place to start.
Test 2: ADC Reading and RC Discharge
For the ADC test I wanted something more interesting than only turning a potentiometer. A potentiometer is useful, but an RC discharge curve is much more fun because it gives me something that exists in three worlds at once:
- simulated in LTspice,
- measured by the ESP32-C3 ADC,
- visible as a real exponential curve.
The circuit is simple:
1
2
3
4
5
6
7
IO04 -> 10 kOhm -> Vcap
                  |
                100 uF
                  |
                 GND

IO03 ADC --------> Vcap
With R = 10 kOhm and C = 100 uF, the time constant is about one second:
1
2
3
tau = R * C
tau = 10 000 * 0.0001
tau = 1 s
That is slow enough to see clearly, but fast enough that the test does not become boring. The capacitor charges when IO04 is HIGH. Then IO04 goes LOW and the capacitor discharges through the resistor while IO03 reads the voltage.
At first I printed the ADC values into Serial Monitor as CSV. It worked, but honestly, it was not very human-friendly. Since Part 3 already proved that Zdenduino can serve a web page, the better version is obvious: make the board show its own graph in the browser.
Before wiring it on the breadboard, I simulated the idea in LTspice.
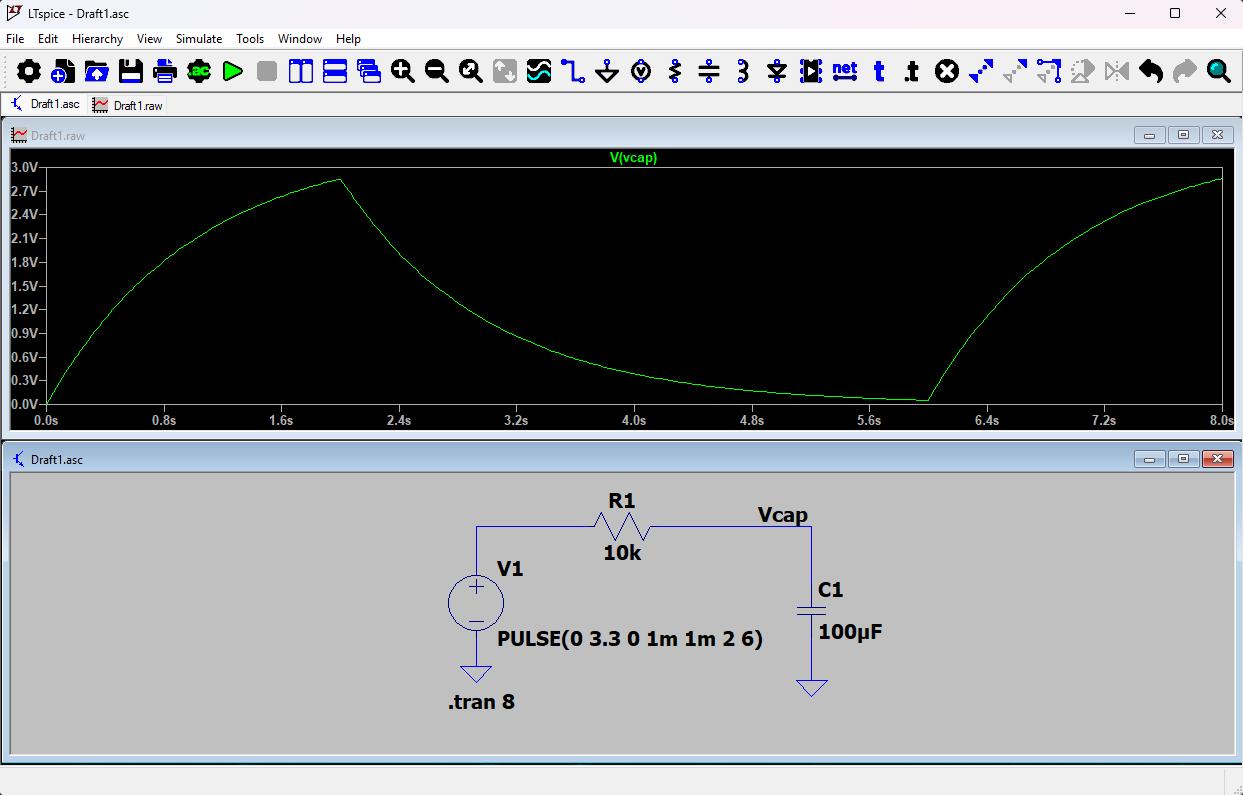
And here is the test sketch for Zdenduino. It creates a tiny web GUI with one button and a live canvas graph:
Full tiny web lab sketch
1
2
3
4
5
6
7
8
9
10
11
12
13
14
15
16
17
18
19
20
21
22
23
24
25
26
27
28
29
30
31
32
33
34
35
36
37
38
39
40
41
42
43
44
45
46
47
48
49
50
51
52
53
54
55
56
57
58
59
60
61
62
63
64
65
66
67
68
69
70
71
72
73
74
75
76
77
78
79
80
81
82
83
84
85
86
87
88
89
90
91
92
93
94
95
96
97
98
99
100
101
102
103
104
105
106
107
108
109
110
111
112
113
114
115
116
117
118
119
120
121
122
123
124
125
126
127
128
129
130
131
132
133
134
135
136
137
138
139
140
141
142
143
144
145
146
147
148
149
150
151
152
153
154
155
156
157
158
159
160
161
162
163
164
165
166
167
168
169
170
171
172
173
174
175
176
177
178
179
180
181
182
183
184
185
186
187
188
189
190
191
192
193
194
195
196
197
198
199
200
201
202
203
204
205
206
207
208
209
210
211
212
213
214
215
216
217
218
219
220
221
222
223
224
225
226
227
228
229
230
231
232
233
234
235
236
237
238
239
240
241
242
243
244
245
246
247
248
249
250
251
252
253
254
255
256
257
258
259
260
261
262
263
264
265
266
267
268
269
270
271
272
273
274
275
276
277
278
279
280
281
282
283
284
285
#include <Arduino.h>
#include <WiFi.h>
#include <WebServer.h>

const char* ssid = "YOUR_WIFI_NAME";
const char* password = "YOUR_WIFI_PASSWORD";

const int chargePin = 4;
const int adcPin = 3;

const float adcReferenceVoltage = 3.3;
const int adcMaxValue = 4095;
const int maxSamples = 260;

const unsigned long preDischargeMs = 1000;
const unsigned long chargeDurationMs = 6000;
const unsigned long dischargeDurationMs = 6000;
const unsigned long sampleIntervalMs = 50;

WebServer server(80);

enum TestPhase {
  IDLE,
  PRE_DISCHARGE,
  CHARGING,
  DISCHARGING
};

struct Sample {
  unsigned long timeMs;
  int raw;
  float voltage;
};

Sample samples[maxSamples];
int sampleCount = 0;

TestPhase testPhase = IDLE;
unsigned long phaseStartMs = 0;
unsigned long testStartMs = 0;
unsigned long lastSampleMs = 0;

const char pageHtml[] PROGMEM = R"rawliteral(
<!doctype html>
<html>
<head>
  <meta name="viewport" content="width=device-width, initial-scale=1">
  <title>Zdenduino RC ADC</title>
  <style>
    body{font-family:system-ui;margin:2rem;max-width:54rem;background:#05070d;color:#e8f4ff}
    button{font-size:1rem;padding:.7rem 1rem;background:#06233d;color:#e8f4ff;border:1px solid #00aaff;border-radius:6px;box-shadow:0 0 14px rgba(0,170,255,.35)}
    button:hover{background:#073052}
    canvas{width:100%;height:360px;background:#00040a;border:1px solid #0d6fa8;border-radius:8px;box-shadow:0 0 28px rgba(0,170,255,.28), inset 0 0 32px rgba(0,170,255,.08)}
    code{background:#101b2a;color:#7ce7ff;padding:.15rem .35rem;border-radius:.25rem}
  </style>
</head>
<body>
  <h1>Zdenduino RC ADC</h1>
  <p>IO04 charges and discharges the capacitor. IO03 reads <code>Vcap</code>.</p>
  <p><button onclick="startTest()">Run charge/discharge test</button></p>
  <canvas id="chart" width="900" height="360"></canvas>
  <p id="status">Waiting for data...</p>

  <script>
    const canvas = document.getElementById('chart');
    const ctx = canvas.getContext('2d');
    const status = document.getElementById('status');
    const chargeEndsAt = 6000;
    const totalDuration = 12000;
    const voltageMax = 4.0;

    async function startTest() {
      await fetch('/start');
      status.textContent = 'Running...';
    }

    function draw(samples) {
      ctx.clearRect(0, 0, canvas.width, canvas.height);
      ctx.fillStyle = '#00040a';
      ctx.fillRect(0, 0, canvas.width, canvas.height);
      ctx.font = '14px system-ui';
      ctx.fillStyle = '#b8d7ee';
      ctx.strokeStyle = '#12324d';
      ctx.lineWidth = 1;

      for (let v = 0; v <= voltageMax; v += 1) {
        const y = canvas.height - (v / voltageMax) * canvas.height;
        ctx.beginPath();
        ctx.moveTo(0, y);
        ctx.lineTo(canvas.width, y);
        ctx.stroke();
        ctx.fillText(v.toFixed(0) + ' V', 8, Math.max(14, y - 4));
      }

      for (let t = 0; t <= totalDuration; t += 2000) {
        const x = (t / totalDuration) * canvas.width;
        ctx.beginPath();
        ctx.moveTo(x, 0);
        ctx.lineTo(x, canvas.height);
        ctx.stroke();
        ctx.fillText((t / 1000).toFixed(0) + 's', x + 4, canvas.height - 8);
      }

      if (samples.length < 2) return;

      const start = 0;
      const end = totalDuration;
      const span = Math.max(1, end - start);
      const phaseX = ((chargeEndsAt - start) / span) * canvas.width;

      ctx.strokeStyle = '#1f7fb6';
      ctx.setLineDash([6, 6]);
      ctx.beginPath();
      ctx.moveTo(phaseX, 0);
      ctx.lineTo(phaseX, canvas.height);
      ctx.stroke();
      ctx.setLineDash([]);
      ctx.fillStyle = '#b8d7ee';
      ctx.fillText('discharge starts', phaseX + 8, 16);

      const points = samples.map(sample => ({
        x: ((sample.t - start) / span) * canvas.width,
        y: canvas.height - (Math.min(sample.v, voltageMax) / voltageMax) * canvas.height
      }));

      function strokeCurve(color, width) {
        ctx.strokeStyle = color;
        ctx.lineWidth = width;
        ctx.lineJoin = 'round';
        ctx.lineCap = 'round';
        ctx.beginPath();
        points.forEach((point, index) => {
          if (index === 0) ctx.moveTo(point.x, point.y);
          else ctx.lineTo(point.x, point.y);
        });
        ctx.stroke();
      }

      strokeCurve('rgba(0, 132, 255, 0.18)', 26);
      strokeCurve('rgba(0, 180, 255, 0.28)', 16);
      strokeCurve('rgba(60, 220, 255, 0.62)', 8);
      strokeCurve('#7df0ff', 3);

      const last = samples[samples.length - 1];
      status.textContent = `Latest: ${last.t} ms, raw ${last.raw}, ${last.v.toFixed(3)} V`;
    }

    async function refresh() {
      const response = await fetch('/data');
      const data = await response.json();
      draw(data.samples);
      if (!data.running && data.samples.length) status.textContent += ' - finished';
    }

    setInterval(refresh, 200);
    refresh();
  </script>
</body>
</html>
)rawliteral";

bool testRunning() {
  return testPhase != IDLE;
}

float rawToVoltage(int raw) {
  return (raw * adcReferenceVoltage) / adcMaxValue;
}

void addSample(unsigned long elapsedMs) {
  if (sampleCount >= maxSamples) {
    return;
  }

  int raw = analogRead(adcPin);
  samples[sampleCount] = {elapsedMs, raw, rawToVoltage(raw)};
  sampleCount++;
}

void handleRoot() {
  server.send_P(200, "text/html", pageHtml);
}

void handleStart() {
  sampleCount = 0;
  testPhase = PRE_DISCHARGE;
  phaseStartMs = millis();
  testStartMs = 0;
  lastSampleMs = 0;

  digitalWrite(chargePin, LOW);
  server.send(200, "text/plain", "started");
}

void handleData() {
  String json = "{\"running\":";
  json += testRunning() ? "true" : "false";
  json += ",\"samples\":[";

  for (int i = 0; i < sampleCount; i++) {
    if (i > 0) {
      json += ",";
    }

    json += "{\"t\":";
    json += samples[i].timeMs;
    json += ",\"raw\":";
    json += samples[i].raw;
    json += ",\"v\":";
    json += String(samples[i].voltage, 3);
    json += "}";
  }

  json += "]}";
  server.send(200, "application/json", json);
}

void updateTest() {
  if (testPhase == IDLE) {
    return;
  }

  unsigned long now = millis();

  if (testPhase == PRE_DISCHARGE && now - phaseStartMs >= preDischargeMs) {
    testPhase = CHARGING;
    phaseStartMs = now;
    testStartMs = now;
    lastSampleMs = 0;
    digitalWrite(chargePin, HIGH);
  }

  if (testPhase == CHARGING || testPhase == DISCHARGING) {
    unsigned long elapsed = now - testStartMs;

    if (now - lastSampleMs >= sampleIntervalMs) {
      addSample(elapsed);
      lastSampleMs = now;
    }
  }

  if (testPhase == CHARGING && now - phaseStartMs >= chargeDurationMs) {
    testPhase = DISCHARGING;
    phaseStartMs = now;
    digitalWrite(chargePin, LOW);
  }

  if (testPhase == DISCHARGING && now - phaseStartMs >= dischargeDurationMs) {
    testPhase = IDLE;
  }
}

void setup() {
  Serial.begin(115200);
  delay(1000);

  pinMode(chargePin, OUTPUT);
  digitalWrite(chargePin, LOW);

  analogReadResolution(12);
  analogSetPinAttenuation(adcPin, ADC_11db);

  WiFi.mode(WIFI_STA);
  WiFi.begin(ssid, password);

  Serial.print("Connecting to Wi-Fi");
  while (WiFi.status() != WL_CONNECTED) {
    delay(500);
    Serial.print(".");
  }

  Serial.println();
  Serial.print("Open http://");
  Serial.println(WiFi.localIP());

  server.on("/", handleRoot);
  server.on("/start", handleStart);
  server.on("/data", handleData);
  server.begin();
}

void loop() {
  server.handleClient();
  updateTest();
}
The ESP32 ADC is not a precision lab instrument, so I am not expecting perfect measurement-grade voltage readings. For this test, the important part is the shape: the graph should rise toward 3.3 V during charging, then fall quickly at first and slowly approach zero during discharge, just like the LTspice curve.
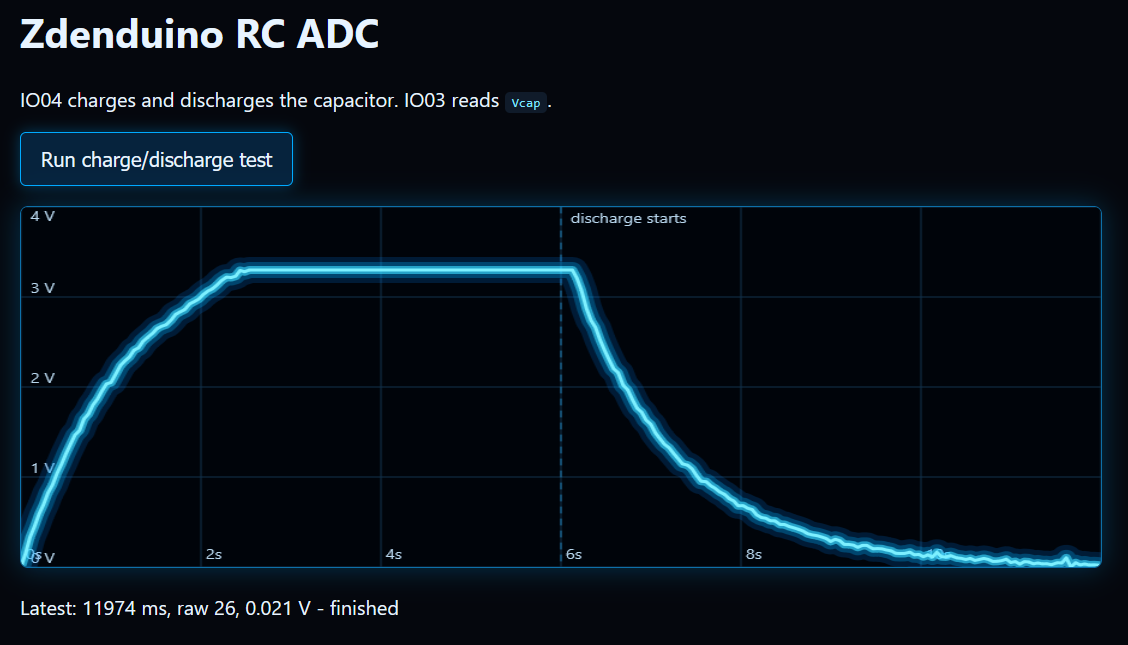
And this feels much better than staring at Serial Monitor. The board is not only measuring the RC curve, it is serving the visualization too. Tiny web lab instrument energy.
Test 3: BLE Scanner
After Wi-Fi, GPIO, PWM, and ADC, it is time to check the other radio inside the ESP32-C3: Bluetooth Low Energy.
This first BLE test is intentionally simple. No pairing, no phone app, no custom services yet. Zdenduino will just scan nearby BLE advertisements and print what it finds into Serial Monitor every 10 seconds.
That should be enough to prove that the BLE stack starts correctly and that the board can see real BLE devices around it.
1
2
3
4
5
6
7
8
9
10
11
12
13
14
15
16
17
18
19
20
21
22
23
24
25
26
27
28
29
30
31
32
33
34
35
36
37
38
39
40
41
42
43
44
45
46
47
#include <Arduino.h>
#include <NimBLEDevice.h>

const int scanTimeSeconds = 5;
const int pauseBetweenScansMs = 10000;

void setup() {
  Serial.begin(115200);
  delay(1000);

  Serial.println("Zdenduino BLE scanner test");
  NimBLEDevice::init("Zdenduino");
}

void loop() {
  Serial.println();
  Serial.println("Scanning for BLE devices...");

  NimBLEScan* scanner = NimBLEDevice::getScan();
  scanner->setActiveScan(true);
  scanner->setInterval(100);
  scanner->setWindow(80);

  NimBLEScanResults results = scanner->getResults(scanTimeSeconds, false);
  int count = results.getCount();

  Serial.printf("Found %d BLE device(s)\n", count);

  for (int i = 0; i < count; i++) {
    const NimBLEAdvertisedDevice* device = results.getDevice(i);

    String name = device->haveName()
      ? String(device->getName().c_str())
      : String("<no name>");

    Serial.printf(
      "%2d: %-28s RSSI: %4d dBm  Address: %s\n",
      i + 1,
      name.c_str(),
      device->getRSSI(),
      device->getAddress().toString().c_str()
    );
  }

  scanner->clearResults();
  delay(pauseBetweenScansMs);
}
What to check:
- Nearby BLE devices appear in Serial Monitor
- RSSI values change when devices move closer or farther away
- Devices without a public name still show up by address
- The scan repeats cleanly every 10 seconds
And yay, it works! I can see something in Serial Monitor. I am not completely sure what all of these devices are, but they are definitely here around me nevertheless.
I redacted the BLE addresses before publishing them. Maybe they are random private addresses, maybe they rotate, maybe they are totally boring. Still, publishing nearby device identifiers feels unnecessary.
1
2
3
4
5
6
7
8
9
10
11
12
13
14
15
16
17
18
19
20
21
22
23
24
25
26
27
28
Zdenduino BLE scanner test

Scanning for BLE devices...
Found 0 BLE device(s)

Scanning for BLE devices...
Found 0 BLE device(s)

Scanning for BLE devices...
Found 1 BLE device(s)
 1: <no name>                    RSSI:  -92 dBm  Address: xx:xx:xx:xx:xx:xx

Scanning for BLE devices...
Found 0 BLE device(s)

Scanning for BLE devices...
Found 0 BLE device(s)

Scanning for BLE devices...
Found 0 BLE device(s)

Scanning for BLE devices...
Found 1 BLE device(s)
 1: <no name>                    RSSI:  -80 dBm  Address: xx:xx:xx:xx:xx:xx

Scanning for BLE devices...
Found 1 BLE device(s)
 1: <no name>                    RSSI:  -93 dBm  Address: xx:xx:xx:xx:xx:xx
Test 4: BLE LED Control
The BLE scanner proved that Zdenduino can see Bluetooth Low Energy devices around it. The next step is more interesting: make Zdenduino become a BLE device and control something from a phone.
For this test, I used the same simple LED on IO04. Zdenduino creates a BLE GATT server with one writable characteristic. If the phone writes 1 or on, the LED turns on. If it writes 0 or off, the LED turns off.
The easiest way to test this is with a generic BLE app such as nRF Connect:
- Upload the sketch.
- Open Serial Monitor.
- Open nRF Connect on a phone.
- Scan for
Zdenduino LED. - Connect to it.
- Find the writable LED characteristic.
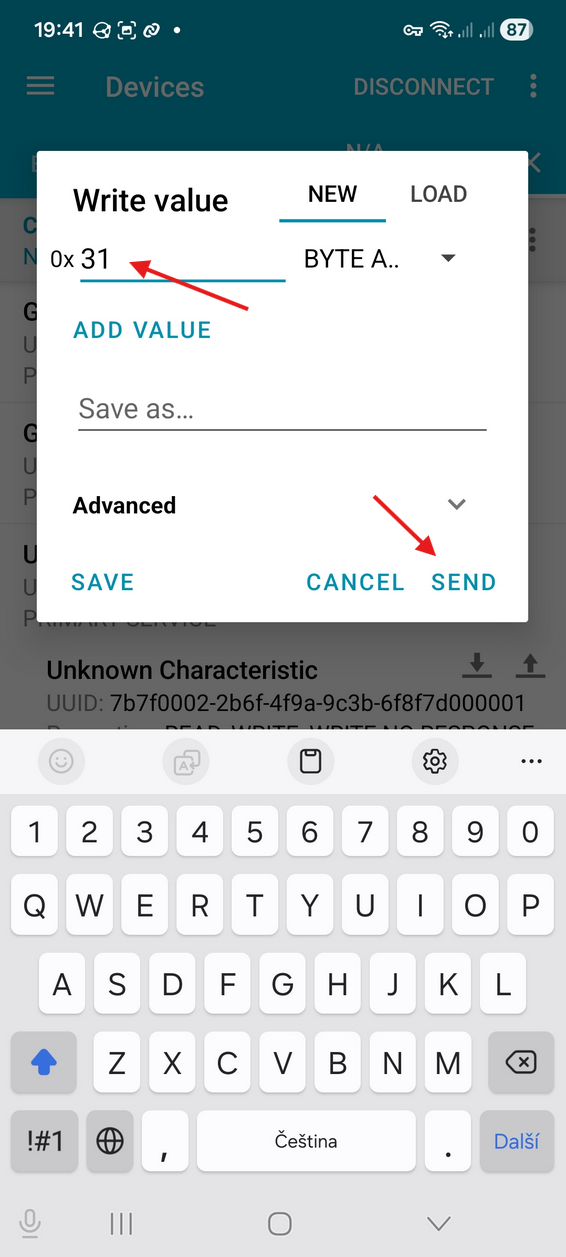
- Write hex
31to turn the LED on, or hex30to turn it off.
1
2
3
4
5
6
7
8
9
10
11
12
13
14
15
16
17
18
19
20
21
22
23
24
25
26
27
28
29
30
31
32
33
34
35
36
37
38
39
40
41
42
43
44
45
46
47
48
49
50
51
52
53
54
55
56
57
58
59
60
61
62
63
64
65
66
67
68
#include <Arduino.h>
#include <NimBLEDevice.h>

const int ledPin = 4;

const char* deviceName = "Zdenduino LED";
const char* serviceUuid = "7b7f0001-2b6f-4f9a-9c3b-6f8f7d000001";
const char* ledCharacteristicUuid = "7b7f0002-2b6f-4f9a-9c3b-6f8f7d000001";

NimBLECharacteristic* ledCharacteristic;
std::string lastCommand = "";
bool ledState = false;

void setLed(bool state) {
  ledState = state;
  digitalWrite(ledPin, ledState ? HIGH : LOW);
  Serial.println(ledState ? "LED ON" : "LED OFF");
}

void setup() {
  Serial.begin(115200);
  delay(1000);

  pinMode(ledPin, OUTPUT);
  setLed(false);

  Serial.println("Starting Zdenduino BLE LED control test");

  NimBLEDevice::init(deviceName);

  NimBLEServer* server = NimBLEDevice::createServer();
  NimBLEService* service = server->createService(serviceUuid);

  ledCharacteristic = service->createCharacteristic(
    ledCharacteristicUuid,
    NIMBLE_PROPERTY::READ | NIMBLE_PROPERTY::WRITE | NIMBLE_PROPERTY::WRITE_NR
  );

  ledCharacteristic->setValue("0");
  service->start();

  NimBLEAdvertising* advertising = NimBLEDevice::getAdvertising();
  advertising->addServiceUUID(serviceUuid);
  advertising->setName(deviceName);
  advertising->start();

  Serial.println("BLE advertising started");
  Serial.println("Write 1/on or 0/off to the LED characteristic");
}

void loop() {
  std::string command = ledCharacteristic->getValue();

  if (command != lastCommand) {
    lastCommand = command;

    Serial.print("BLE write: ");
    Serial.println(command.c_str());

    if (command == "1" || command == "on" || command == "ON") {
      setLed(true);
    } else if (command == "0" || command == "off" || command == "OFF") {
      setLed(false);
    }
  }

  delay(100);
}
What to check:
- Zdenduino appears as
Zdenduino LEDin a BLE scanner app - The phone can connect to the GATT server
- Writing hex
31turns the LED on - Writing hex
30turns the LED off - Serial Monitor prints the received BLE writes
In nRF Connect it was not immediately obvious where the actual control was hiding. The scanner first showed a new device after powering Zdenduino, but the name did not appear directly in the main scan list. I had to connect and dig a bit deeper to find it.
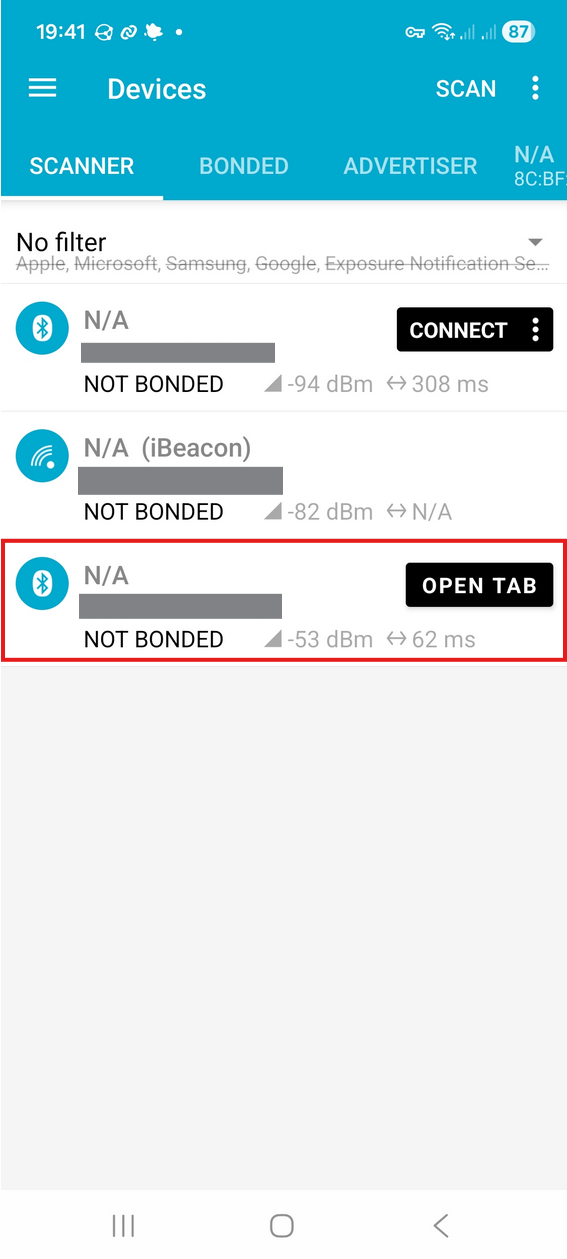
Inside the connected device, the important part was the custom service starting with 7b7f0001.... The grey upward arrow is the write button for the characteristic.
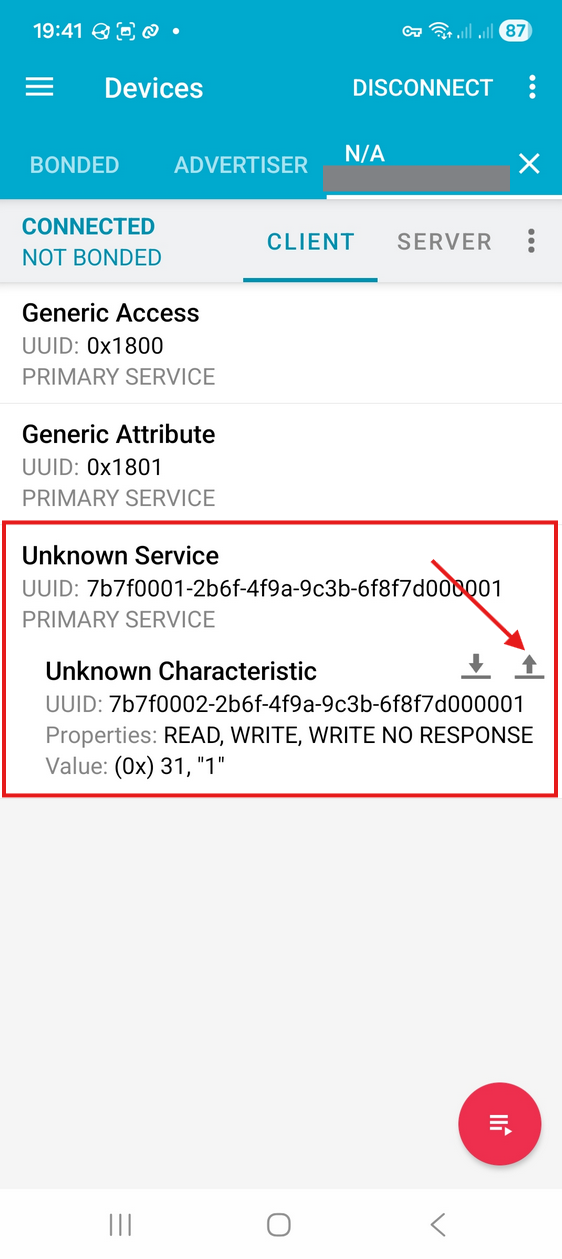
One small practical detail: in this app I had to write the value as hexadecimal. ASCII 1 is 31, and ASCII 0 is 30. So 31 turns the LED on.
And here is the Serial Monitor output:
1
2
3
4
5
6
7
8
9
10
11
12
13
ESP-ROM:esp32c3-api1-20210207
LED OFF
Starting Zdenduino BLE LED control test
BLE advertising started
Write 1/on or 0/off to the LED characteristic
BLE write: 0
LED OFF
BLE write: 1
LED ON
BLE write: 0
LED OFF
BLE write: 1
LED ON
So yes, it works. I am not going to try to photograph the LED blinking this time. Please just trust me, it blinked beautifully. :D
Later Ideas
- SoftAP mode and captive portal
- HTTP client / API fetch
- Deep sleep current test
- USB CDC debug console
- Wi-Fi to Serial bridge
- Mini oscilloscope / logic analyzer
- RGB LED web controller
- WebSocket realtime terminal
- Tiny reusable IoT firmware framework
Problems, Surprises, and Tiny Victories
The nicest surprise was how quickly the board moved from separate hardware tests into tiny self-hosted tools. The ADC test could have stayed as a boring CSV dump, but the ESP32-C3 was perfectly happy measuring the capacitor and serving the graph at the same time. That makes the whole thing feel much more alive.
The Arduino-ESP32 LEDC API change was the small annoying part. A lot of older examples use the 2.x PWM functions, while current Arduino-ESP32 3.x uses the newer pin-based API. Not a disaster, just one of those little compatibility traps that costs more time than the actual circuit.
BLE was also slightly less obvious than Wi-Fi. Scanning worked, advertising worked, and the phone could control the LED, but generic BLE apps expose quite a lot of raw detail. Finding the right characteristic and writing the value in the right format was not hard, but it was definitely less friendly than opening a browser.
Tiny victory list: PWM worked, ADC worked, Wi-Fi graphing worked, BLE scanning worked, BLE control worked. That is a pretty good day for a small homemade board.
What This Proved
This round proved that Zdenduino is not just a board that happens to boot. It can generate PWM, read analog values, run Wi-Fi, host a small web interface, scan BLE advertisements, and expose its own BLE GATT service.
It also proved that the pin choices are usable for real experiments. IO04 can drive an LED, generate PWM, and charge the RC test circuit. IO03 can read the analog voltage well enough for visual experiments. The ESP32-C3 module, USB circuit, power, GPIO, Wi-Fi, and BLE are all behaving well enough to keep building on top of them.
Most importantly, the board is now fun to use. That matters. A board can be technically correct and still feel awkward. Zdenduino is starting to feel like something I can actually reach for when I want to test an idea.
What Comes Next?
The next obvious step is OTA update, because once Wi-Fi works, uploading firmware without touching the USB cable feels like the correct kind of laziness. I want to test the partition setup, the upload flow, and also think about the boring-but-important recovery path for failed updates.
After that, MQTT / Home Assistant makes sense. A small board that can publish a sensor value and subscribe to an LED command is already most of the way toward being a useful home automation node. Home Assistant discovery would make it feel properly polished.
And finally, I want to try an async web dashboard. The simple blocking web server is fine for these tests, but a more responsive dashboard with live uptime, RSSI, GPIO state, ADC value, and maybe WebSocket updates would be a much better base for future experiments.
So stay tuned!